Data-Driven Decision Making:Transforming Snapp’s Support System with UX Research
Led a multi-phase research initiative to uncover adoption barriers, build stakeholder alignment, and validate IA redesign, resulting in measurable cost savings and improved user satisfaction.
Background and Problem
Snapp operated a 900-agent call center, costing approximately (~$315K monthly, ≈ $3.8M annually).
As the user base grew, call volumes increased rapidly, yet users still waited an average of 5 minutes to reach an agent, causing frustration.
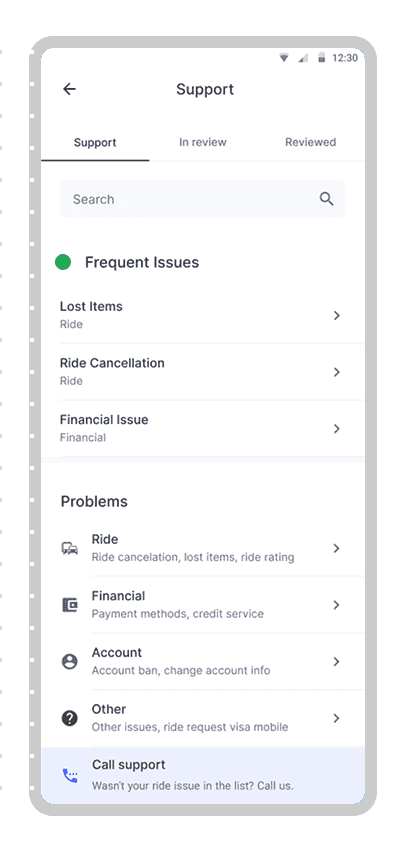
Digital support solutions (in-app ticketing and FAQs) existed but were underutilized (20% adoption). Leadership needed to understand:
- Why users avoided digital support channels.
- Whether a shift to self-service was realistic.
- How to reduce call center costs without harming the user experience.
Goals:
- Identify experience-level problems preventing users from choosing digital solutions.
- Understand the gap between call center and in-app support usage.
- Assess whether it was realistic to expect users to convert to self-service channels.
Metrics
- Increase conversion rate to in-app support channels.
- Decrease incoming call volume to the call center.
- Improve user satisfaction scores in monthly surveys.

Stakeholders and Collaboration:
This was a high-visibility project involving:
- Product Managers: Needed evidence to prioritize fixes and guide future development.
- Call Center Operations & Leadership: Sought cost reduction while maintaining service quality.
- UX Designer: Required validated insights to redesign the support experience.
I worked closely with these stakeholders throughout the project:
- Workshops: Presented findings, facilitated discussions, and helped leadership reach consensus on next steps.
- Collaboration: Partnered with PM on data sampling and with Designer during usability sessions (note-taking, observation).
- Decision Influence: Guided stakeholders toward testing IA improvements and validating them with data before rollout.

Constraints and Challenges:
No tracking tools: Limited ability to observe real user behavior in the app (no event tags, no session replays). Relied on call/ticket tag data and qualitative methods.
- Tight timeline: Project delivered in 1 month while managing two other product verticals.
- High stakes: Stakeholders required evidence-backed recommendations before committing resources to large-scale changes, creating a need for quantitative validation in Phase 2.

Phase 1
Exploring Barriers to Digital Support Adoption
Content Analysis
What we did:
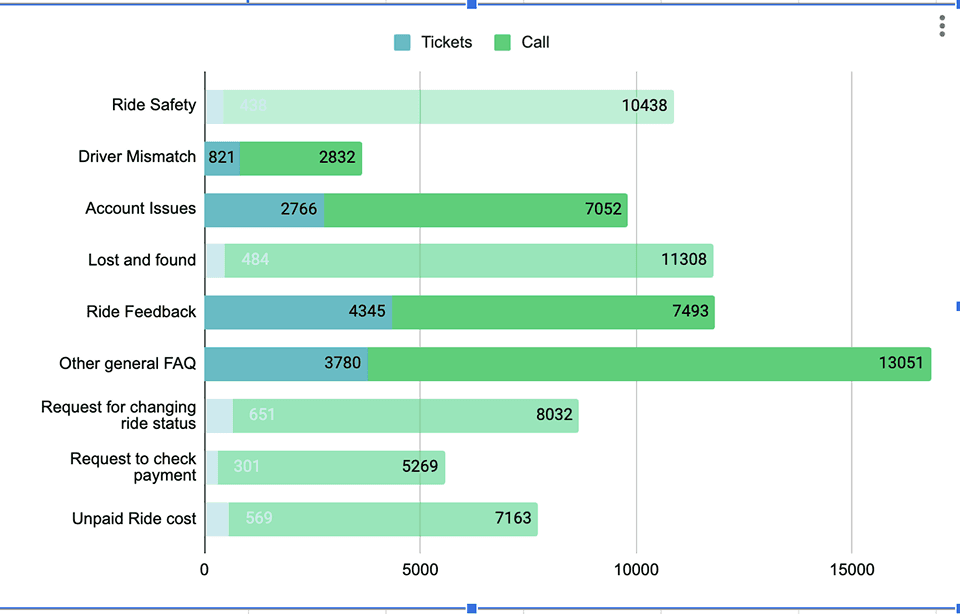
- Analyzed ~87,000 support interactions (14K tickets, 73K calls) from one month.
- Reviewed tags provided by the call center (main + subcategories).
- Compared frequency of issues across tickets and calls to visualize where users chose calls instead of tickets.
What we Found:
- ~40% of call requests overlapped with issues already handled well through in-app tickets (e.g., FAQs, lost & found).
- These were mostly non-critical topics, meaning they could have been resolved digitally if users trusted or found the channel easily.
Usability Test & Interview:
What we did:
- Recruited 10 active users who had contacted support in the past week.
- Conducted in-depth interviews to explore their expectations, frustrations, and decision-making process between calls and tickets.
- Ran usability tasks on the in-app support section to observe real navigation behavior, confusion points, and drop-offs.
- A UX designer joined sessions as a note taker and observer while I led facilitation and follow-up probing.


What we Found:
- Incomplete user flow: Users didn’t know what happens after ticket submission, fearing their issue would remain unresolved.
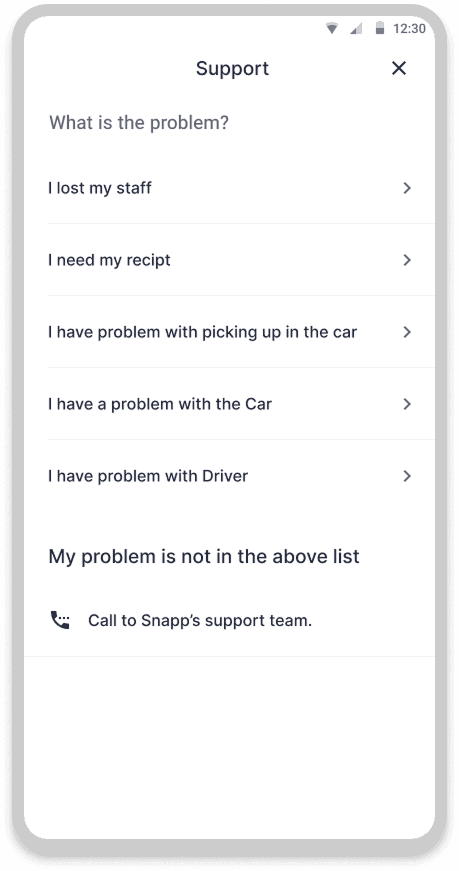
- Poor information architecture: Categories were unclear, overlapping, or in unexpected locations, forcing guesswork.
- Weak UX writing: Labels lacked guidance, making it unclear where to go or what would happen next.
- Urgent or sensitive cases: Users avoided tickets altogether, preferring calls for speed and reassurance.
- Complex process: Uploading documents or extra steps made ticketing slower than calling in some cases.
Insights & Recommendations:
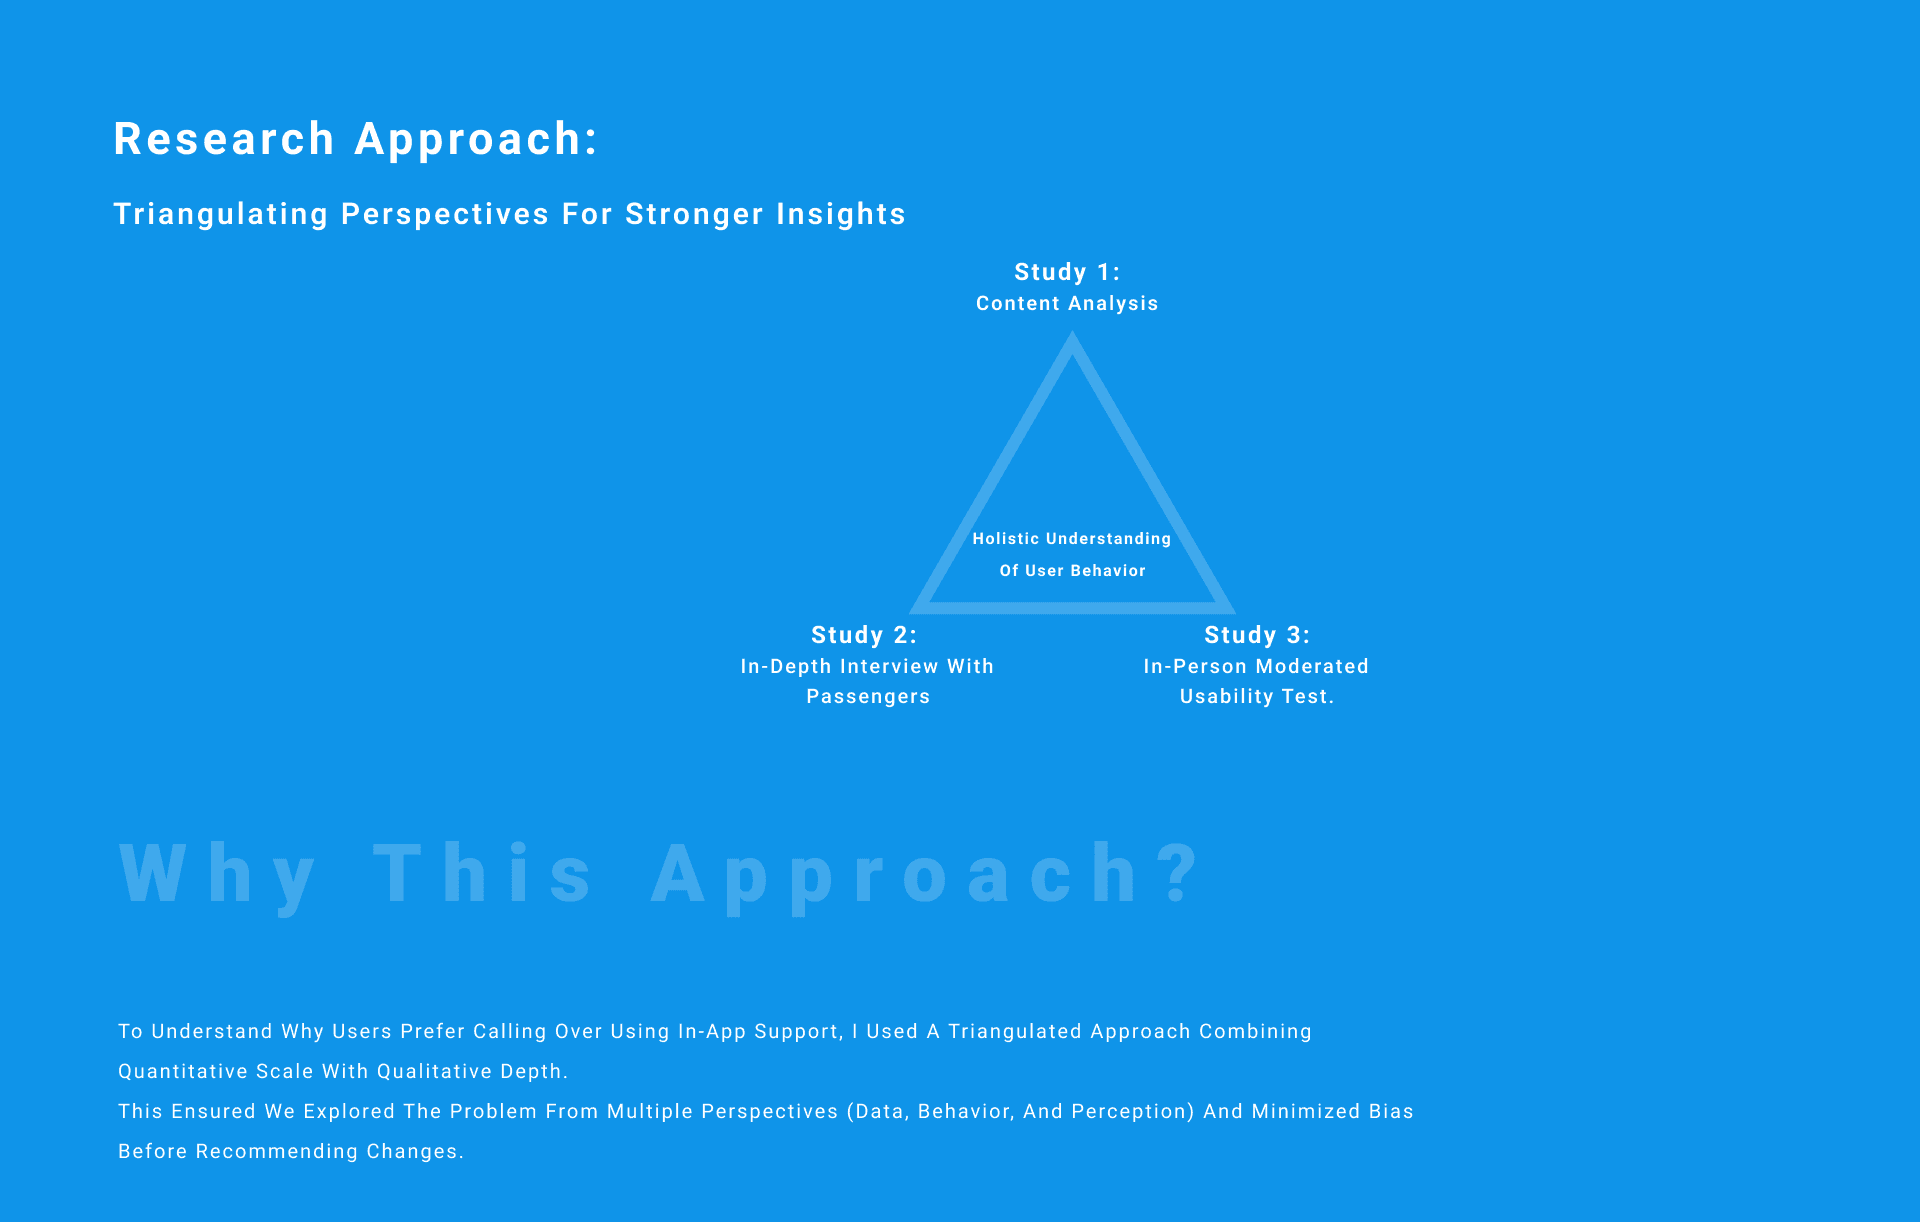
Combining findings from data analysis, interview and usability test revealed that low adoption of digital support is not an awareness issue, but a findability and trust issue:
- Information Architecture and UX writing are key barriers to using tickets.
- Users need clearer guidance, simpler steps, and visible feedback after submission to trust the process.
Fixing these issues could shift ~40% of calls to self-service channels, reducing operational load and cost while improving user experience.
I recommended:
- Testing improvements to IA and wording to align with user mental models.
- Validating these changes quantitatively before committing to a full redesign.

Phase 2
Discovering IA Problems.

Why we Ran Phase 2 ?
From Phase 1, we uncovered clear usability issues in the current Information Architecture (IA) that caused low adoption of in-app support.
Stakeholders agreed these issues existed, but a full IA redesign would require significant resources (design time, engineering changes, testing).
Before committing to a costly rollout, leadership needed data proving that a revised IA would deliver measurable improvements in findability, task success, and overall user confidence.
To reduce risk and build confidence, I designed a quantitative validation study, combining Card Sorting and Tree Testing, to test IA improvements before implementation.

Hybrid Card Sorting (Qualitative Exploration)
Goal
Understand how users mentally group support topics.
Process
- 20 participants, randomly recruited from active users.
- In-office moderated sessions where participants grouped and renamed issues into categories that made sense to them.
- Used a hybrid approach (open + closed sorting) to allow flexibility while testing pre-existing categories.
- Analyzed results with a similarity matrix, clustering cards with ≥60% agreement to propose a new IA structure.

Outcome
A proposed new IA structure based on user mental models.

Tree Testing (Measuring IA Performance)
Goal
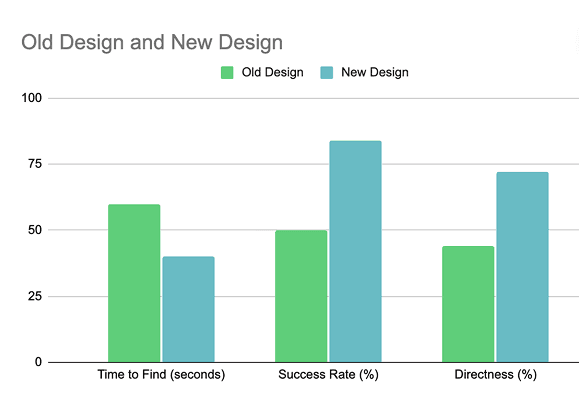
Compare the old IA vs. the new IA for accuracy and efficiency.
Process
- 97 participants per tree (old IA vs. new IA).
- Remote unmoderated test via (Lysnna Usertesting platform.)
- Measured task success rate, time to find, and navigation directness.
- Confidence level 90%, margin of error 10%.

Outcome
- New IA improved success rate, reduced errors and time-to-find significantly compared to the old IA.
- Provided quantitative proof that redesigning IA would create measurable value.
Impact
Within the first month post-launch:
- 📈 Digital adoption increased: 20% → 29% usage of in-app support.
- 📉 Call volume reduced: ~20% fewer calls, saving an estimated $60K/month in staffing costs.
- 😊 User satisfaction improved: +3% increase in monthly survey scores.

Thanks for reading
Pooria Hassanzadeh
2023